Saving money often feels like an intangible goal hidden behind spreadsheets and banking apps. When your progress remains confined to numbers, it’s easy to lose drive and skip deposits. But by presenting financial data in vivid, engaging ways, you can transform dry budgets into powerful motivators. Visual tools clarify your journey, highlight milestones, and tap into the part of your brain that craves stories and color.
Whether you’re aiming for an emergency fund, a down payment on a home, or simply building better habits, using visuals can make your targets more concrete and emotionally resonant. This article explores the science behind visualization, showcases the best tools, and provides step-by-step guidance to keep you inspired through every savings milestone.
The Power of Visualization in Personal Finance
Our brains are hardwired to process visual information quickly. Approximately 65 percent of the population are visual learners, and studies confirm visuals engage both cognitive and emotional centers simultaneously. When abstract financial goals become illustrated charts or colorful trackers, they shift from distant ideas to tangible objects you can almost touch.
Metaphors—like seeing your savings as a growing tree—activate neural pathways linked to real experiences. This dual engagement of head and heart makes you remember your goals more clearly and strengthens your commitment to saving. In essence, visuals boost both understanding and motivation.
Types of Visual Tools for Saving
Different visual formats serve various purposes. From high-level dashboards to daily trackers, each tool offers unique benefits:
- Infographics and Charts: Pie charts and bar graphs reveal spending categories at a glance, making it easy to spot overspending.
- Goal Trackers: Milestone bars and thermometers show incremental progress toward specific amounts, turning each deposit into a mini-celebration.
- Net Worth Visualizations: Line graphs chart assets minus liabilities over time, offering a clear picture of long-term growth.
- Debt Repayment Maps: Flowcharts outline snowball or avalanche strategies, breaking down complex paydown plans into simple steps.
- Vision Boards: Collages of images, charts, and inspirational words constantly remind you why you’re saving in the first place.
Psychological and Motivational Aspects
Visual tools do more than display numbers; they boost self-efficacy and confidence. When you see proof of progress, your brain translates that into belief in your ability to succeed. Interactive elements—like dragging sliders or coloring segments—enhance that effect by making you an active participant in your journey.
Gamification adds another level of engagement. Points, badges, and animated progress bars turn saving into a game with rewards and feedback loops. This taps into intrinsic motivators: autonomy, competence, and relatedness. You feel in control, capable of achieving milestones, and connected to a broader community of savers.
Technologies and Apps
The market for personal finance management tools is booming, valued at $1.45 billion in 2018 and projected to reach $3.3 billion by 2025. Leading apps integrate advanced visual features and AI-driven insights:
Emerging platforms leverage AI to generate instant visualizations of spending patterns and savings forecasts. Customization—through color coding, category labeling, and milestone settings—ensures that each tool resonates with your personal preferences and goals.
How to Implement Visual Tools in Your Routine
Creating and maintaining visual finance tools doesn’t require design expertise. Here’s how to start:
- Build a Visual Budget: Use spreadsheet templates or budgeting apps to assign colors to expense categories. Update weekly to track fluctuations and adjust allocations.
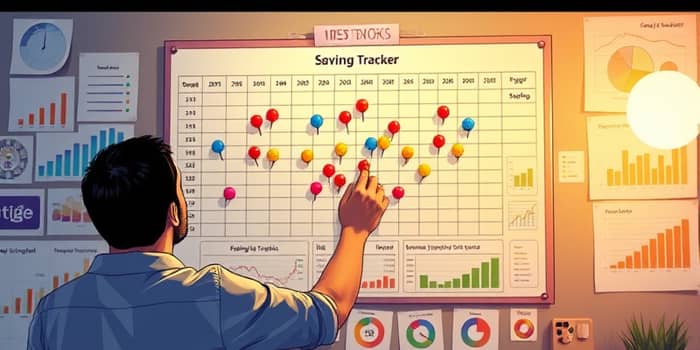
- Set Up a Savings Tracker: Draw a simple progress bar on paper or in a digital tool. Divide it into equal segments representing subgoals. Place a sticker or change the color each time you deposit.
- Lay Out a Debt Timeline: Sketch a timeline marking each required payment date. Check off installments visually to reinforce momentum.
- Create a Vision Board: Gather images and words that embody your financial dreams. Pin them on a physical board or design a digital collage you can set as a phone wallpaper.
Consistency is key. Schedule a brief weekly review session—five minutes to update charts, celebrate tiny wins, and realign your strategy if needed.
Motivational Tactics Using Visual Tools
To keep your enthusiasm high, integrate these tactics:
- Frequent Visual Reminders: Place charts where you’ll see them daily—on your fridge, desk, or phone home screen.
- Celebrate Small Wins: Reward yourself with a fun sticker, a shareable social media graphic, or a quick treat when you hit a subgoal.
- Peer Accountability: Join online forums or group challenges. Share screenshots of your progress bars and cheer each other on.
By weaving visual tools into your daily life, you transform abstract savings targets into dynamic goals. You experience frequent emotional rewards and clear feedback, which drive sustained action.
Measuring Impact and Staying on Track
Visual tools help you spot patterns at a glance. In your weekly review, look for trends: Is one category consistently over budget? Are deposits slowing down? Use these insights to adjust your plan proactively.
Keep a simple journal next to your charts. Record feelings and observations—frustrations, triumphs, or surprising discoveries. This qualitative layer adds context to the visuals, making them even more meaningful.
Conclusion
Saving money doesn’t have to be a dreary exercise in discipline. By harnessing the science of visualization, you tap into powerful cognitive and emotional motivators. Infographics, goal trackers, net worth graphs, and vision boards all serve as dynamic reminders of your mission.
With clear visuals and consistent reviews, you build self-efficacy and momentum. You turn each small deposit into a visible victory and each chart update into a source of inspiration. Embrace these tools, and you’ll find yourself not just saving more, but enjoying the journey every step of the way.
References
- https://enrichest.com/en/blog/visualizing-personal-finance-exploring-infographics-for-financial-planning
- https://www.penncommunitybank.com/blog/visualize-success-creating-your-2025-financial-vision-board/
- https://enrichest.com/en/blog/power-of-personal-finance-visualization-visual-tools-for-financial-success
- https://ssir.org/articles/entry/the_science_of_what_makes_people_care
- https://www.youtube.com/watch?v=sbaoAlVvP6U
- https://www.contactmonkey.com/blog/employee-newsletter-ideas